The Challenge
Screentime, a digital content analytics company, was growing fast—but their reporting processes weren’t keeping up. Each department generated its own reports, with inconsistent formatting and delayed submissions. Leadership struggled to consolidate financial data in time for monthly reviews, and the team was spending hours each week manually compiling spreadsheets.
Disconnected reporting across a fast-moving team
Screentime, a digital analytics company, operated with multiple departments producing their own financial reports. The lack of a shared system meant finance leads had to manually compile data for executive reporting—often under tight deadlines.
Inconsistent data formats and missed deadlines
Each department used different spreadsheet formats and reporting cycles, making cross-team alignment difficult. End-of-month reports were often delayed, incomplete, or contradictory—leading to frustration at both the team and leadership level.
Limited insight for proactive planning
Without real-time data, Screentime’s leadership was forced to rely on outdated numbers to guide key decisions. They lacked a consolidated view of where money was going or how different teams were performing financially.
The Solution
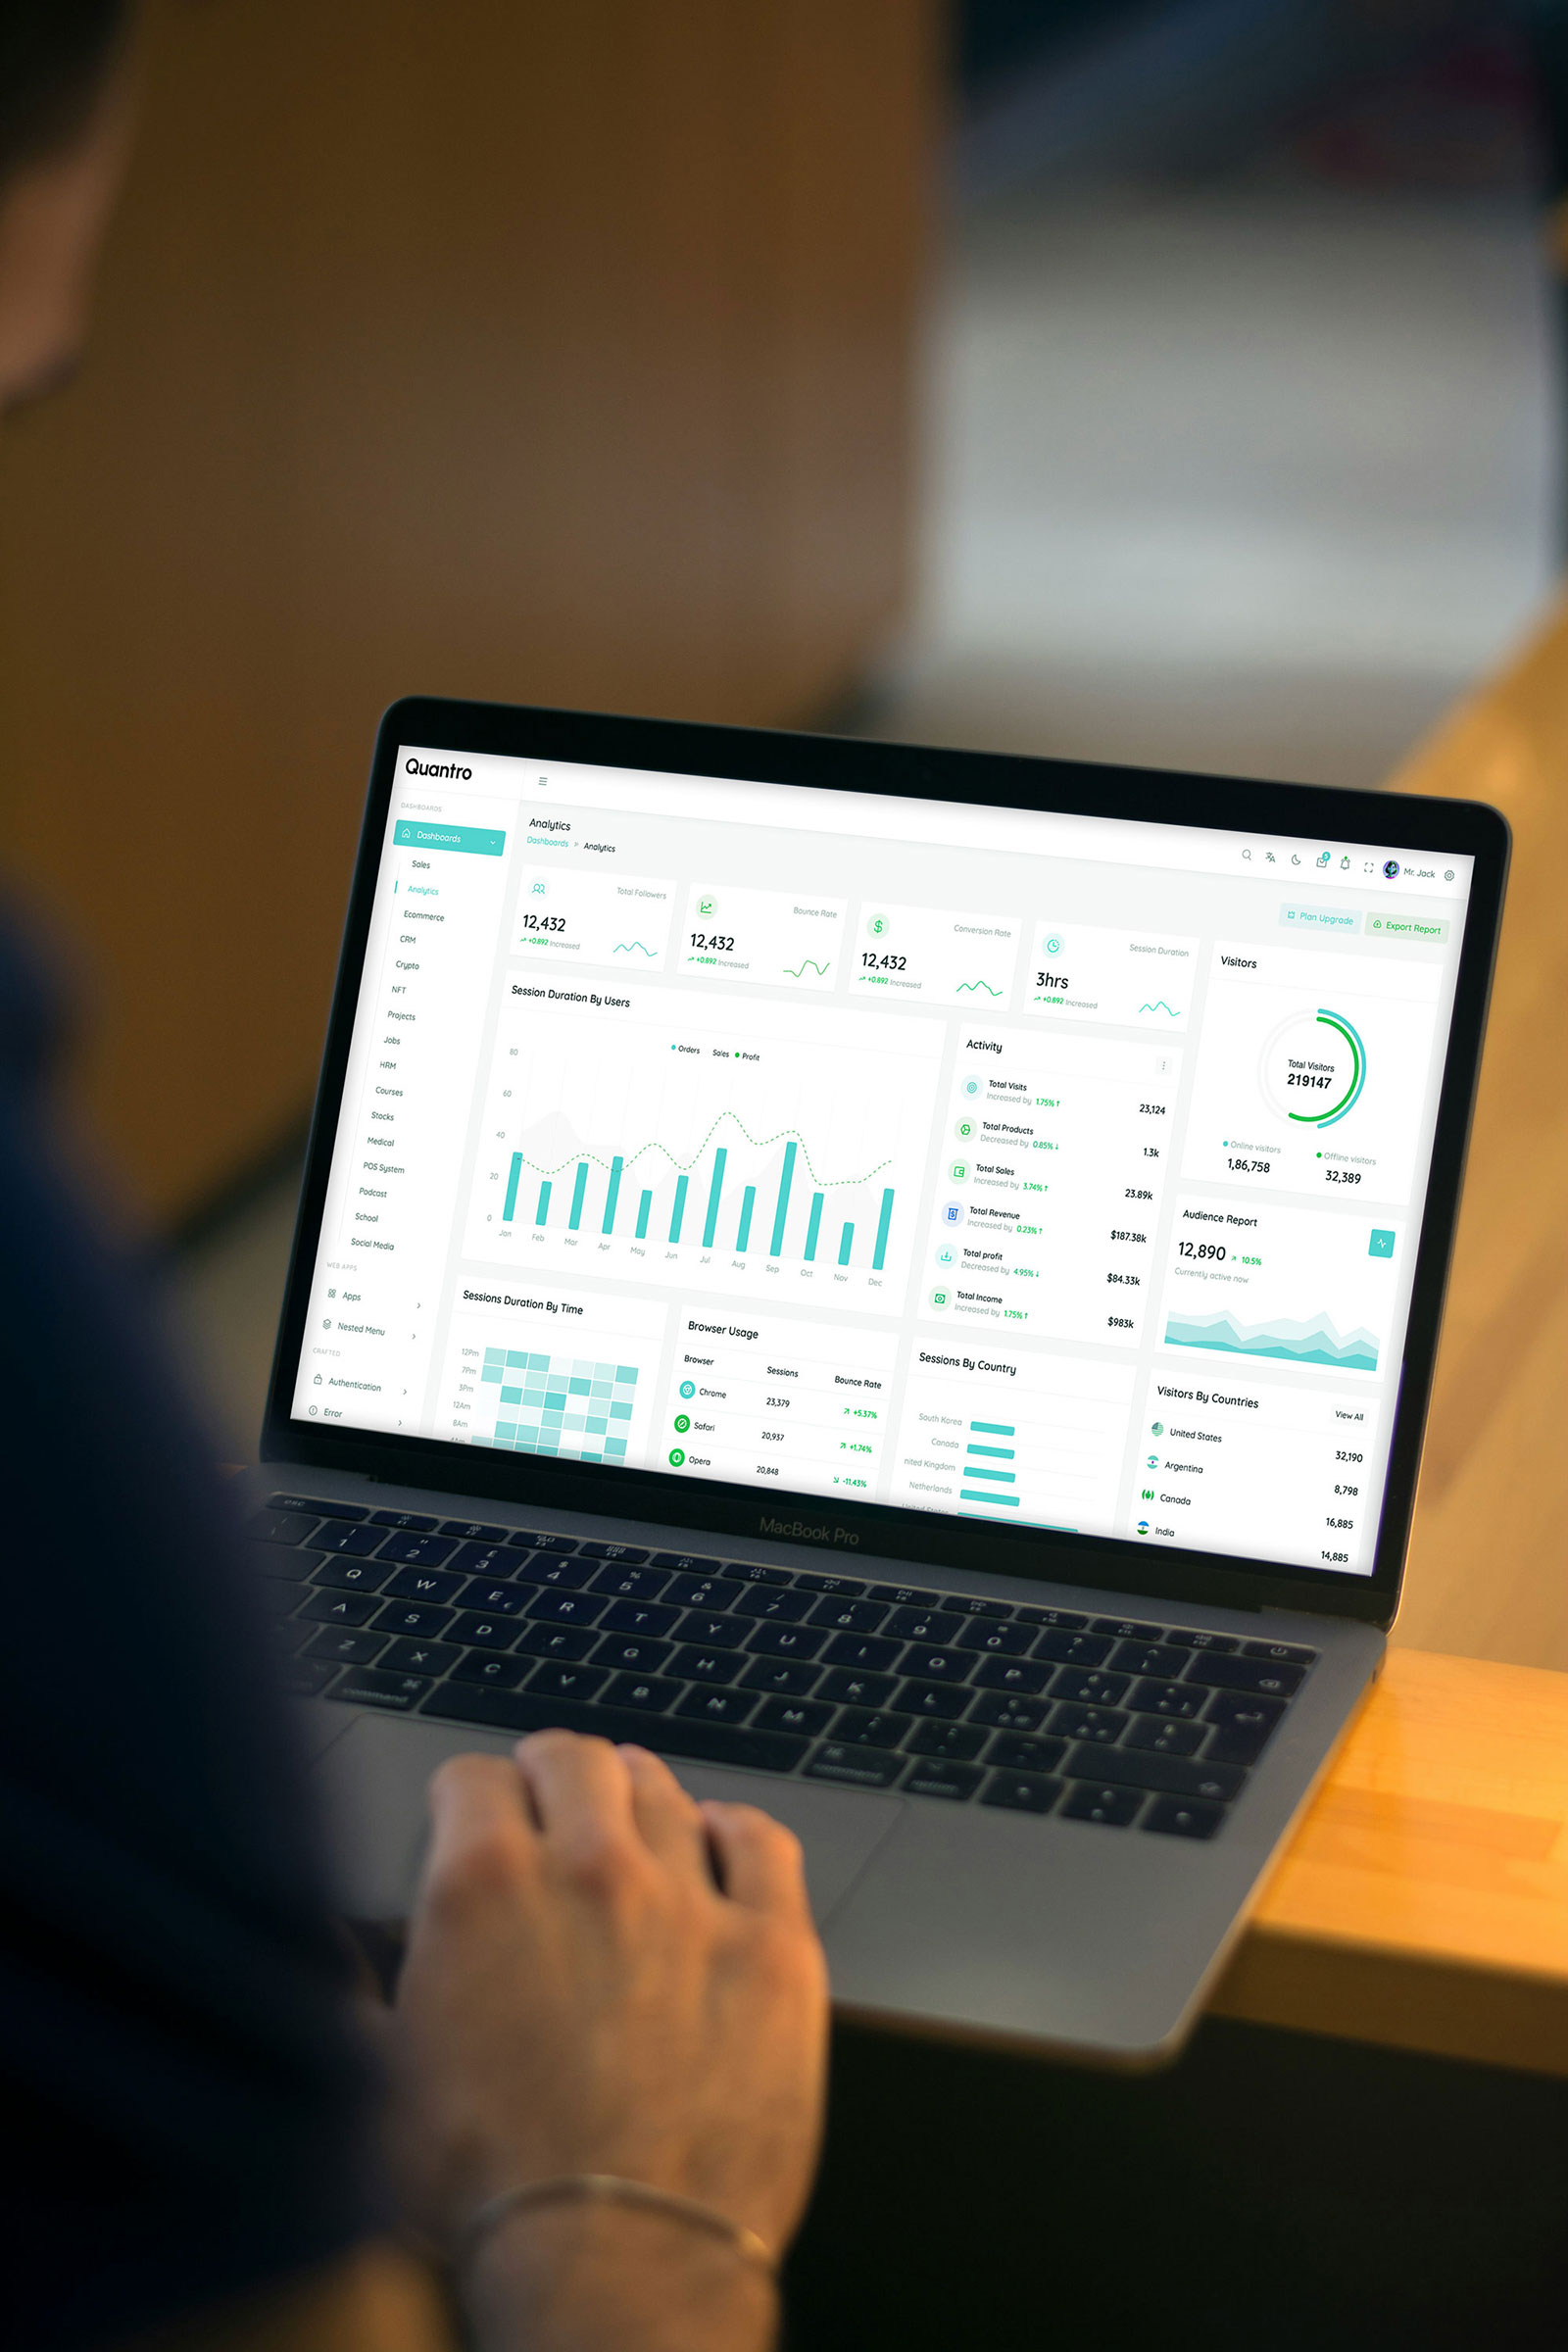
Quantro was brought in to centralize reporting and give Screentime’s leadership access to live dashboards with real-time data. The platform’s customizable templates and built-in permissions helped unify reporting standards across departments without slowing teams down.
A single platform for reporting clarity and control
Screentime adopted Quantro to unify financial reporting across all departments and replace manual compilation with automated, real-time dashboards.
Custom report templates for each team
Quantro’s flexible reporting tools allowed each department to create reports tailored to their needs—while still aligning with global financial formats set by the finance team.
Live data that leadership could trust
Instead of waiting for the finance team to compile numbers, executives could log into Quantro and instantly access high-level dashboards, team breakdowns, and spending insights.
Implementation
Working closely with Screentime’s finance and operations teams, we implemented department-specific reporting templates that could automatically pull data from their integrated tools. We also trained team leads to create on-demand summaries using Quantro’s visual dashboards—eliminating the need for manual formatting or cross-checking.
Department-by-department onboarding
The finance team began by onboarding the analytics and product teams—who produced the largest volume of budget data. Once their reports were standardized, the process was repeated across other departments.
Weekly reviews to refine templates and logic
Each team participated in a review session to fine-tune reporting templates and define what metrics mattered most. This collaborative process ensured buy-in and usefulness across the board.
Training built for speed and simplicity
Because many team leads weren’t familiar with financial tools, training focused on using dashboards and submitting accurate data without deep technical know-how. The clean UI and guided workflows helped drive fast adoption.

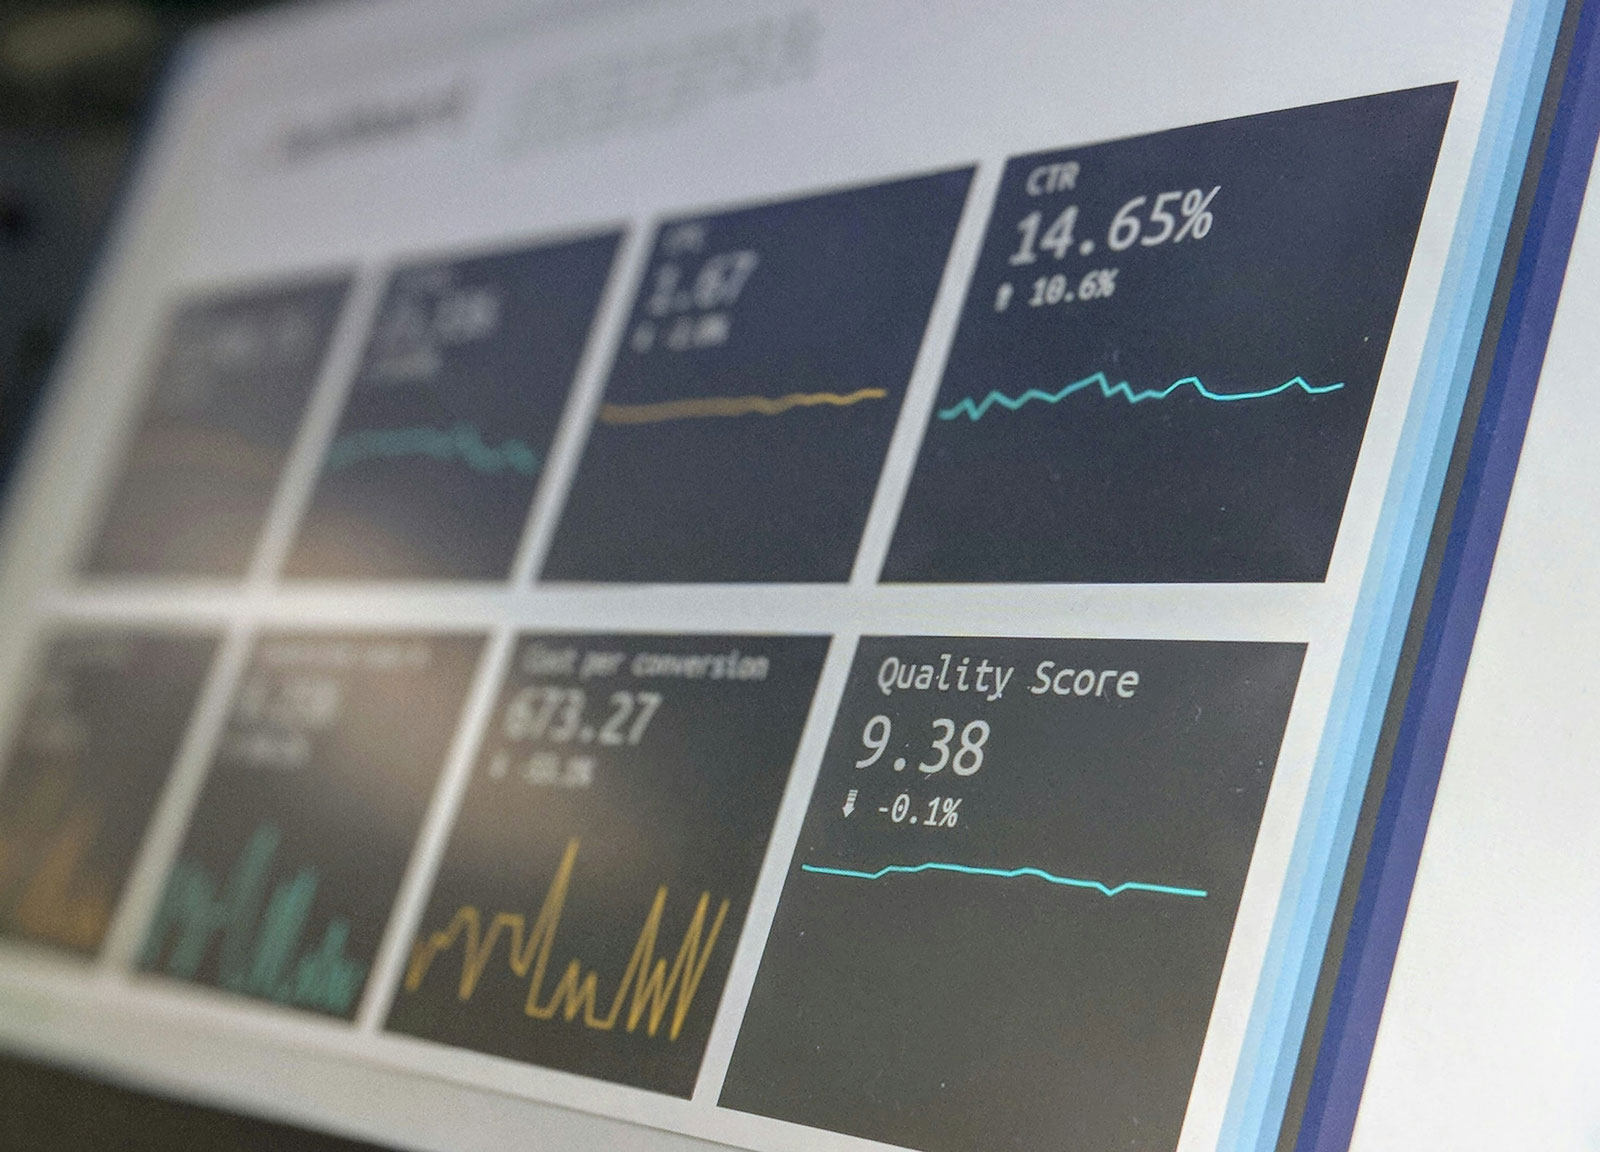
A closer look at how Quantro transforms financial operations across teams and tools.
Since implementing Quantro, Screentime has reduced monthly report prep time by over 50%. Leadership now receives consistent, up-to-date insights every week, empowering faster strategic planning.
“Quantro gave us back our Mondays. We no longer scramble to prepare reports—everything’s ready, real-time, and aligned.” — Elena Brooks, Operations Manager at Screentime
Transformative Results
Screentime replaced manual reporting with live dashboards that improved accuracy and speed.
With real-time dashboards and standardized reporting, Screentime significantly improved access to critical insights—helping leadership act faster and with more confidence.
Reduction in time spent on monthly reporting cycles.
Increase in real-time access to financial performance data.